• 트리거는 테이블의 Data가 변경시에 사용한다.
  • A Table의 트리거를 사용하여 B Table에 insert할 경우에는 B Table의 Primary key를 잘 선택 해야 한다. 
  • B Table의 Key로 인해서, Trigger의 동작이 Error나면, A Table의 Data도 insert되지 않는다. 
  • A Table의 트리거를 사용하여 Romote Server에 insert하지 않아야 한다. 
  • Connection이 끊어졌을경우, Trigger는 Error나게 되고, 소실된 Data를 찾을 수 없다. 
  • Remote서버에 insert할 경우에는 Procedure를 이용하여 작업한다. 


1. 트리거(Trigger)란?


트리거(Trigger)란 영어로 방아쇠라는 뜻인데, 방아쇠를 당기면 그로 인해 총기 내부에서 알아서 일련의 작업을 실행하고 총알이 날아갑니다. 이처럼 데이터베이스에서도 트리거(Trigger)는 특정 테이블에 INSERT, DELETE, UPDATE 같은 DML 문이 수행되었을 때, 데이터베이스에서 자동으로 동작하도록 작성된 프로그램입니다. 즉! 사용자가 직접 호출하는 것이 아니라, 데이터베이스에서 자동적으로 호출하는 것이 가장 큰 특징입니다. 


트리거(Trigger)는 테이블과 뷰 데이터베이스 작업을 대상으로 정의할 수 있으며, 전체 트랜잭션 작업에 대해 발생되는 트리거(Trigger)와 각행에 대해 발생되는 트리거(Trigger)가 있습니다.


2. 트리거(Trigger)가 적용되는 예


다음과 같은 상황에서 트리거(Trigger)를 사용할 수 있습니다. 어떤 쇼핑몰에 하루에 수만 건의 주문이 들어옵니다. 주문데이터는 주문일자, 주문상품, 수량, 가격이 있으며, 수천명의 임직원이 일자별, 상품별 총 판매수량과 총 판매가격으로 구성된 주문 실적을 실시간으로 온라인상에 조회를 했을 때, 한사람의 임직원이 조회할 때마다 수만 건의 데이터를 읽고 계산해야합니다. 만약 임직원이 수만명이고, 데이터가 수백만건이라면, 또 거의 동시다발적으로 실시간 조회가 요청된다면 시스템 퍼포먼스가 떨어질 것입니다.


따라서! 트리거(Trigger)를 사용하여 주문한 건이 입력될 때마다, 일자별 상품별로 판매수량과 판매금액을 집계하여 집계자료를 보관하도록 만들어보겠습니다. 먼저 관련된 테이블을 생성해보겠습니다. 

테이블은 다음과 같습니다. 주문정보테이블에 실시간으로 데이터가 입력될 때마다 트리거가 발동되어 자동으로 일자별판매집계테이블에 일자별, 상품별 판매수량과 판매금액을 계산해 업데이트 하는 작업을 하도록 하고, 사용자들은 미리 계산된 일자별판매집계테이블을 조회하게 하여 실시간 조회를 지원하게 하는 것입니다. 


3. 트리거(Trigger) 구현


자, 이제 2개 테이블을 CREATE, DDL을 통해 만들어보겠습니다.


CREATE TABLE ORDER_LIST(

    ORDER_DATE  CHAR(8) NOT NULL,

    PRODUCT     VARCHAR2(10) NOT NULL,

    QTY         NUMBER NOT NULL,

    AMOUNT      NUMBER NOT NULL

);


CREATE TABLE SALES_PER_DATE(

    SALE_DATE   CHAR(8) NOT NULL,

    PRODUCT     VARCHAR2(10) NOT NULL,

    QTY         NUMBER NOT NULL,

    AMOUNT      NUMBER NOT NULL


);


SELECT *

FROM ORDER_LIST


SELECT *

FROM SALES_PER_DATE


조회를 해보면 다음과 같습니다.


아직 2개 테이블다 데이터가 없음을 확인할 수 있습니다. 


이제 트리거(Trigger)를 만들어 보겠습니다. 트리거(Trigger)를 구현하기 위해 우선 절차형 SQL과 PL/SQL을 알아야합니다. 절차형 SQL과 PL/SQL은 따로 글을 올리도록 하고, 오늘은 절차형 SQL과 PL/SQL을 안다는 전제하에 트리거(Trigger)를 구현해보겠습니다.


트리거(Trigger) 처리 절차를 설명하면 다음과 같습니다.

8 ~ 14 Line 

 Trigger를 선언합니다. 

order_list 테이블에 insert가 발생하면 그 이후 each row 즉 각 행에 해당 트리거(Trigger)를 적용한다라는 뜻입니다. 또한, declare 선언문에는 변수를 선언합니다. order_list 테이블에 있는 order_date, product Type에 맞게 o_date, o_prod 변수를 선언합니다.


15 ~17 Line

new 는 트리거(Trigger)에서 사용하는 구조체 입니다. new는 새로 입력된 레코드 값을 담고 있습니다.

o_date 에 새로 들어온 order_date 값을 , o_prod 에 새로 들어온 product 값을 저장합니다.


18 ~ 26 Line

sales_per_date 테이블에 update 구문을 실행하는데, 기존에 있는 qty, amount 를 누적합해서 다시 Set 합니다. 여기서 where문을 통해 현재 새로 들어온 날짜과 상품이 일치하는 데이터만 해당 update문을 실행하도록 조건을 걸었습니다. 

또한 만약 해당 조건에 모두 해당되지 않는다면, if sql%notfound 구문이 실행됩니다. 기존에 있던 레코드 값이 아니고 전혀 새로운 레코드이기 때문에 insert 구문을 통해 새로 들어온 데이터를 새로 삽입합니다. 

끝으로 / 부분은 트리거(Trigger)를 실행하는 실행명령어입니다.


위 구문을 실행하면, 이제 2개 테이블에 트리거(Trigger)가 적용된 것입니다. 


이제 order_list 테이블에 레코드를 insert 해서 sales_per_date 테이블에 트리거(Trigger)가 자동으로 동작하여, 데이터 값을 자동으로 계산하고 반영하는지 확인해보겠습니다!


ORDER_LIST 테이블에 아래와 같이 데이터 값을 삽입해보겠습니다.


-> INSERT INTO ORDER_LIST VALUES('20120901','MONOPACK',10,300000)


삽입후 ORDER_LIST, SALES_PER_DATE 테이블 조회를 해보겠습니다.


ORDER_LIST 정상적으로 값이 삽입되었습니다. 

트리거에 의해서 SALES_PER_DATE 에도 정상적으로 값이 삽입되어있습니다.


자. 다시한번 값을 삽입하고 테이블을 확인해보겠습니다.


-> INSERT INTO ORDER_LIST VALUES('20120901','MONOPACK',20,600000);


ORDER_LIST 를 조회하면 지금까지 삽입한 값들이 리스트로 있습니다. 

SALES_PER_DATE 테이블은 트리거에 의해서 주문날짜별 상품별 물량과 가격이 합산되어 업데이트 되어있음을 확인할 수 있습니다.

4. 트리거(Trigger)와 트랜잭션(Transaction)의 상관관계


이번에는 다른 상품으로 주문 데이터를 입력한 후 두 테이블의 결과를 조회해보고 트랜잭션을 ROLLBACK 해보겠습니다. 판매 데이터의 입력취소가 일어나면, 주문 정보 테이블(ORDER_LIST)과 판매 집계테이블(SALES_PER_DATE )에 동시에 입력(수정) 취소가 일어나는지 확인해보기 위함입니다.


-> INSERT INTO ORDER_LIST VALUES('20120901','MULTIPACK',10,300000);


ORDER_LIST 에 정상적으로 판매 데이터가 삽입되었습니다. 


SALES_PER_DATE 테이블은 트리거에 의해 판매날짜별, 상품별 누적 물량과 가격이 업데이트 되었습니다.


이제 ROLLBACK; 명령어를 실행해보겠습니다. 

ORDER_LIST 테이블에 방금 삽입한 판매데이터가 취소되었습니다.


SALES_PER_DATE 테이블에도 똑같이 트리거로 입력된 데이터 정보까지 하나의 트랜잭션으로 인식하여 입력 취소가 되었습니다. 


즉, 트리거는 데이터베이스에 의해 자동 호출되지만 결국 INSERT, UPDATE, DELETE 구문과 하나의 트랜잭션 안에서 일어나는 일련의 작업들이라 할 수 있다. 

 (추가로 트리거는 Begin ~ End 절에서 COMMIT , ROLLBACK 을 사용할 수 없다.)


산업 모니터링에 관한 다른 Contents도 확인 하세요. 

'ForBeginner' 카테고리의 다른 글

2-2. Types of Sensors  (0) 2021.05.18
8-7. MSSQL(View)  (0) 2021.05.18
8-2-1. MSSQL (Join)  (0) 2021.05.17
8-2. MSSQL(Group by, Having)  (0) 2021.05.17
3-0. 왜 PLC의 이해가 필요한가?  (0) 2021.05.15
  • 중복을 제거하기 위한 Table 디자인으로
  • 분석가능한 의미있는 데이터를 보기 위해서는 반드시 Join의 연습이 필요하다.
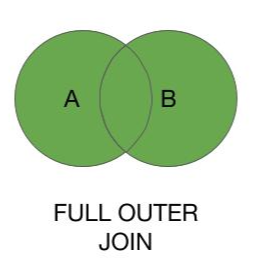
  • 아래 다이어그램의 이해를 바탕으로 어떤 Join을 사용할지 결정 해야 하며,
  • 대부분 Inner Join또는 Left Join이 사용된다. 


조인(JOIN) ? 

두 개 이상의 테이블을 곱한 결과 집합 이라고 간단히 MSDN에 정의되어있다.


JOIN에는 INNER JOIN OUTER JOIN 그리고 CROSS JOIN 이렇게 세가지 종류가 있으며,

실무에서는 대부분 INNER JOIN과  LEFT OUTER JOIN을 사용한다.


그림을 보며 하나씩 알아가 보자.


1. INNER JOIN


교집합의 결과를 출력해 준다고 생각해주면 쉽다.
그림과 같이 두 테이블의 조건에 모두 만족하는 데이터만 출력해 준다.


JOIN유형 생략시 기본적으로 INNER JOIN으로 들어가게 되며,

INNER JOIN시 LEFT,RIGHT같은 기준을 정해주지 않는데, INNER JOIN은 두 조건을 모두 만족하는 결과를 출력해주기 때문에 기준이 되는 테이블을 정해주지 않아도 되기 때문이다.


2. OUTER JOIN

1) LEFT OUTER JOIN


OUTER JOIN이 INNER JOIN과 다른점은 조건에 맞지 않는 데이터도 표시해 준다는 점이다.


LEFT JOIN 수행시 먼저 표기된 좌측 테이블에 해당하는 데이터를 먼저 읽은 후 나중에 표기된 우측 테이블에서 JOIN대상 데이터를 읽어온다. 

즉 A테이블과 B테이블이 있을 때 A가 기준이 되어, A와 B를 비교한다음 B의 JOIN 컬럼에서 같은 값이 있을 때 해당 데이터를 가져오고 B의 JOIN컬럼에서 같은 값이 없는 경우에는 B테이블에서 가져오는 컬럼들은 NULL 값으로 채우는 것이다.


참고로 OUTER JOIN은 기본적으로 LEFT OUTER JOIN으로 명시되며, OUTER 키워드는 생략가능하다.


2) RIGHT OUTER JOIN


RIGHT JOIN은 LEFT JOIN과는 반대로 우측 테이블이 기준이 된다고 생각하면 된다.


3) FULL OUTER JOIN


JOIN 수행시 좌측과 우측의 모든 데이터를 읽고 JOIN 후 결과를 생성하며, 두 개의 테이블 모두가 기준이 된다.

합집합의 결과를 출력해준다고 생각하면 쉽다.


단 UNION ALL이 아닌 UNION 기능과 같으므로 중복 데이터는 삭제된다.


3. CROSS JOIN


CROSS JOIN은 상호 조인이라고도 불리며, 한 쪽 테이블의 모든 행들과 다른 테이블의 모든 행을 조인시키는 기능을 한다.

그래서 CROSS JOIN의 결과 개수는 두 테이블의 행의 개수를 곱한 개수가 된다.


CROSS문은 모든 행에 대한 결합이 발생하기 때문에 ON구문을 사용할 수 없다.

예전에는 데이터에 대한 카피 후 연산이나 부분합을 구할 때 쓰였지만, 지금은 CUBE나 GROUPPING으로 대체되었고 현재는 잘 쓰지 않는다.


산업 모니터링에 관한 다른 Contents도 확인 하세요. 

'ForBeginner' 카테고리의 다른 글

8-7. MSSQL(View)  (0) 2021.05.18
8-5. 트리거(Trigger)  (0) 2021.05.18
8-2. MSSQL(Group by, Having)  (0) 2021.05.17
3-0. 왜 PLC의 이해가 필요한가?  (0) 2021.05.15
3-4. PLC 통신 종류  (0) 2021.05.15
No. 01
그룹 함수


그룹 함수는 검색된 여러 행을 이용하여 통계정보를 계산하는 함수이다.


그룹 함수

함수명 기능 사용
 COUNT  행의 수를 계산한다.   COUNT(컬럼 | *) 
 MAX  값들 중에 최대 값을 반환한다.   MAX(컬럼) 
 MIN  값들 중에 최소 값을 반환한다.   MIN(컬럼) 
 AVG  평균 값을 계산한다.   AVG(컬럼) 
 SUM  총 합계를 계산한다.   SUM(컬럼)
 VARIANCE  분산을 계산한다.   VARIANCE(컬럼) 
 STDDEV  표준편차를 계산한다.   STDDEV(컬럼) 


◈ 예제

select count(commission_pct), count(nvl(commission_pct,0))

from employees;


보너스를 받지 않는 사람은 commission_pct가 null로 되어있다.

그룹함수는 null 값을 무시하기 때문에 첫 번째의 경우는 보너스를 받는 사람의 수만 계산된 것이고,

두 번째의 경우는 보너스를 받지 않는 사람은 0으로 만들어 줌으로써 전체 사원의 수가 계산된 것이다.


select avg(salary) 평균급여1, round(avg(salary)) 평균급여2

from employees;


평균급여1 같은 경우 출력 값의 형식은 세션의 설정이나 평균급여2와 같이 단일 함수를 이용해서 지정할 수 있다.


select sum(salary) 총액, round(avg(salary)) 평균, count(*) 전체인원

from employees;


select min(salary), max(salary), min(hire_date), max(hire_date)

from employees;


MIN, MAX 함수는 숫자 뿐만 아니라 날짜, 문자에도 사용할 수 있다. 문자의 경우 글자수로 판단한다.

이름을 가지고 MIN, MAX 함수를 사용해 보자.


No. 02
GROUP BY 절


특정 속성을 기준으로 그룹화 하여 검색할 때 그룹화 할 속성을 지정한다.


기본 구조

SELECT [DISTINCT] 컬럼, 그룹 함수(컬럼)

FROM 테이블명

[WHERE 조건]

[GROUP BY Group대상]

[ORDER BY 정렬대상 [ASC/DESC]]

  • SELECT 절에 그룹 함수와 컬럼명이 같이 기술된 경우 해당 컬럼은 반드시 GROUP BY절에 그룹화 돼야 한다.
  • 결과 값이 정렬되길 원한다면 반드시 ORDER BY 절을 추가한다.3


GROUP BY 절은 반드시 그룹함수와 함께 쓰이며 그룹 함수의 결과 값은 GROUP BY 절에 기술된 컬럼의 항목들의 행의 개수에 의해 결정된다.


◈ 예제

select department_id, round(avg(salary))

from employees

group by department_id;


각 부서별로 사원들 급여의 평균 값이 계산됐다.

일반 언어로 표현한다면 GROUP BY절에 기술된 '컬럼(부서)'별로 평균(그룹 함수)를 계산하라.


GROUP BY절의 의미는 그룹 함수를 GROUP BY절에 지정된 컬럼의 값이 같은 행에 대해서 통계 정보를 계산하라는 의미이다.


select round(avg(salary))

from employees

group by department_id;


GROUP BY절에 기술된 컬럼이 SELECT절에 기술되지 않아도 된다.

위의 경우 부서별로 사원들 급여의 평균 값이 계산됐지만 어느 부서의 평균 값인지 모르기 때문에 쓸모없는 정보나 마찬가지이다.

그러므로 SELECT절에도 GROUP BY절에 기술된 컬럼을 기술하길 권한다.


▶ 2개 이상의 그룹화

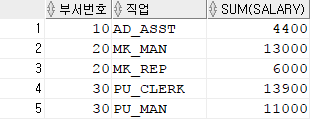
select department_id 부서번호, job_id 직업, sum(salary)

from employees

group by department_id, job_id

order by department_id;


위의 예를 보면 20번 부서가 2번 나와 있는데 이는 같은 부서일지라도 직업이 다르기 때문에 다른 그룹으로 묶인 것이다.


select department_id 부서번호, job_id 직업, manager_id 상사번호, sum(salary)

from employees

group by department_id, job_id, manager_id

order by department_id;


이번에는 부서번호와 직업이 같은 경우라도 하나의 그룹으로 묶이지 않았다. 이번에는 GROUP BY절에 상사번호까지 기술했기 때문이다.

부서번호, 직업, 상사번호까지 같아야 하나의 그룹으로 묶여 그룹함수의 계산이 이루어진다.

추가로 GROUP BY절을 사용할 경우 ORDER BY절을 사용하기를 권한다.(파악하기 좋게 하기 위해서)


즉, 여러 컬럼을 그룹화 할 경우 GROUP BY절에 나열된 컬럼들의 값이 모두 같아야 같은 그룹으로 묶인다.


▶ 그룹 함수를 중첩해서 사용하는 경우

select department_id 부서번호, max(avg(salary)) 최대평균, min(avg(salary)) 최소평균

from employees

group by department_id;

ORA-00937: not a single-group group function

00937. 00000 -  "not a single-group group function"


부서번호를 그룹화 했음에도 불구하고 위의 예제의 경우 에러가 발생한다.

max(avg()), min(avg())는 평균값의 최대 값과 최소 값이므로 어떤 컬럼으로 그룹을 하던 결과는 최대 값 하나 최소 값 하나이다. 그러나 부서번호의 경우 부서별로 그룹을 묶었기 때문에 값이 여러 개이다.

이해가 안된다면 차근차근 생각해보자.

  1. 일단 위의 예제는 부서별로 그룹을 묶었다. 10, 20, 30, … 각 부서마다 그룹으로 묶인 것이다.
  2. 그 후 그룹별로 사원들 급여의 평균 값을 구한다.
  3. 각 그룹별로 평균 값 중에서 최대 값과 최소 값을 구했다. 각각 결과는 하나이다.
  4. select절에 부서번호를 기술했기 때문에 화면에 출력할 때는 그룹으로 묶인 부서들도 보여주어야 한다.

현재는 어느 부서의 최대평균, 최소평균인지는 모른다. 단지 평균값들 중에 최대, 최소가 무엇인지만 검색된 상황이다. 각 부서별로 하나의 행을 차지하고 있을텐데 특정 부서의 옆에 최대평균, 최소평균을 같이 출력한다면 마치 그 부서의 최대평균과 최소평균인 것처럼 보이기 때문에 잘못된 정보가 되버린다. 그래서 이런 상황이 나오지 않도록 예제처럼 SQL문을 작성할 경우 에러로 인식되게 한 것이다.


select max(avg(salary)) 최대평균, min(avg(salary)) 최소평균

from employees

group by department_id;


정리하면 그룹 함수가 중첩된 경우 GROUP BY절에 기술한 컬럼도 출력 할 수 없다.


No. 03
HAVING 절


HAVING 절은 해석상 WHERE 절과 동일하다. 단 조건 내용에 그룹 함수를 포함하는 것만을 포함한다.

일반 조건은 WHERE 절에 기술하지만 그룹 함수를 포함한 조건은 HAVING 절에 기술한다.


기본 구조

SELECT [DISTINCT] 컬럼, 그룹 함수(컬럼)

FROM 테이블명

[WHERE 조건]

[GROUP BY Group대상]

[HAVING 그룹 함수 포함 조건]

[ORDER BY 정렬대상 [ASC/DESC]]

  • HAVING 절은 GROUP BY 절 뒤에 기술한다.
  • HAVING 절의 조건은 그룹 함수를 포함해야 한다.


◈ 예제

select department_id 부서번호, round(avg(salary)) 평균급여

from employees

group by department_id

having avg(salary) < 7000;


SQL문장에서 일반 조건은 WHERE절에 기술하지만 조건에 그룹 함수가 포함된 경우에는 HAVING절에 기술해야 한다.

WHERE절에 그룹 함수가 포함된 조건을 기술하면 에러가 발생한다.


select department_id 부서번호, sum(salary) 급여총액

from employees

group by department_id

having job_id != 'IT_PROG';

ORA-00979: not a GROUP BY expression

00979. 00000 -  "not a GROUP BY expression"


반대로 HAVING 절에 일반 조건을 기술하면 에러가 발생한다.

그러나 GROUP BY에 기술된 컬럼에 대한 일반 조건은 HAVING절에 기술 가능하다. 하지만 그렇게 되면 SQL문을 해석하기 힘들기 때문에 기술하지 않는 것이 좋다.


일반 조건은 WHERE 절에 그룹 함수를 포함한 조건은 HAVING 절에 기술한다.


select job_id, sum(salary) 급여총액

from employees

where job_id not like '%REP%'

group by job_id

having sum(salary) > 13000

order by sum(salary);


GROUP BY 와 HAVING 절까지 기술한 SELECT 구문을 해석해보자.

  1. from 절에 기술한 테이블에서
  2. where 절에 기술한 조건에 해당하는 내용들만 정리하고
  3. 정리된 내용들을 가지고 group by 절에 나열된 컬럼에 대해서 그룹을 만든다.
  4. 만들어진 그룹별로 having절에 기술된 그룹함수로 계산하여 having절 조건에 맞는 그룹만 추리고
  5. 추려진 그룹들을 order by 절에 잇는 조건으로 정렬시킨다.
  6. 마지막으로 select절에 있는 그룹화된 컬럼 또는 그룹함수를 화면에 출력한다.

산업 모니터링에 관한 다른 Contents도 확인 하세요. 

'ForBeginner' 카테고리의 다른 글

8-5. 트리거(Trigger)  (0) 2021.05.18
8-2-1. MSSQL (Join)  (0) 2021.05.17
3-0. 왜 PLC의 이해가 필요한가?  (0) 2021.05.15
3-4. PLC 통신 종류  (0) 2021.05.15
3-3. PLC 모듈 종류  (0) 2021.05.14


  • 일반적으로
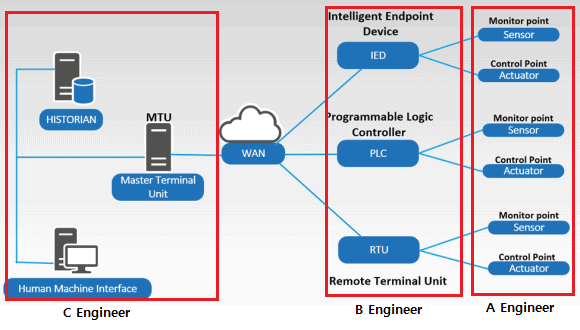
  • Sensor의 설치 및 PLC와 의 결선은 A Enginner가, 
  • 설비의 Controller의 PLC, Touch Screen은 B Engineer가, 
  • 모니터링 프로그램 개발은 C Engineer가 하게 되는데, 
  • Sensor의 값이 이상이 있는 것은 C Engineer가 설치한 모니터링 프로그램으로 파악하게 된다. 
  • 고객은 이상현상을 모니터링 프로그램에서 발견하기 때문에
  • Sensor 및 Cable이 이상이 있는지, 
  • 설비 Controller의 프로그램 이상인지, 
  • 모니터링 프로그램의 Bug인지 판단 하지 못하고, 모니터링 프로그램에서 보이기 때문에 
  • C Engineer에게 연락을 하게 된다.


  • 어떤 곳에게 문제가 발생했는지 판단 하지 못하면, 
  • 해결하기 까지 시간이 많이 소요되고, 
  • Engineer간의 Scope 다툼으로 이어질 수 있기 때문에
  • 어디에세 문제가 발생했는지 정확히 파악하여 해당 Engineer에게 자료를 보내주고,
  • 수정할 수 있도록 Guide할 수 있는 능력이 있어야 한다. 
  • 그러기 위해서 모니터링 프로그램 개발자도 반드시 PLC의 이해가 필요한다. 

산업 모니터링에 관한 다른 Contents도 확인 하세요. 

'ForBeginner' 카테고리의 다른 글

8-2-1. MSSQL (Join)  (0) 2021.05.17
8-2. MSSQL(Group by, Having)  (0) 2021.05.17
3-4. PLC 통신 종류  (0) 2021.05.15
3-3. PLC 모듈 종류  (0) 2021.05.14
3-2. Global SCADA Market by 2024  (0) 2021.05.13

List of PLC Communication Protocols

What are networking protocols used in Industrial Automation?

Here, I am listing the different types of communication protocols used for the automation of processes in PLC.

  1. EtherNet/IP
  2. Profibus
  3. Modbus
  4. Interbus
  5. ProfiNet
  6. ControlNet
  7. DeviceNet
  8. DirectNet
  9. CompoNet
  10. RAPIENet
  11. EtherCAT
  12. MelsecNet
  13. Optomux
  14. DF-1 Protocol
  15. HostLink Protocol
  16. MECHATROLINK
  17. DH- Data Highway
  18. PPI- Point to Point
  19. EtherNet Powerlink
  20. MPI- Multi-Point Interface
  21. EGD- Ethernet Global Data
  22. AS-i- Actuator Sensor Interface
  23. OSGP- Open Smart Grid Protocol
  24. DNP3- Distributed Network Protocol
  25. SDS- Smart Distributed System Protocol
  26. PieP- Process Image Exchange Protocol
  27. SRTP- Service Request Transport Protocol
  28. BSAP- Bristol Standard Asynchronous Protocol
  29. FINS- Factory Interface Network Service Protocol
  30. HART- Highway Addressable Remote Transducer Protocol
  31. Recommended Standard (RS-232, RS- 422, and RS-485) Protocols

What is the Baud Rate?

Baud rate is also known as Communication speed.

The rate of data transmission on the network is called Baud Rate. The unit of Baud Rate is bits/second (b/s).

In simple terms, it is calculated as the “number of data transferred per second”.

Characteristics of PLC Communication Protocols in Table

When PLC modules are connected over the network, the standard communication protocols are used.

The different types of standard communication protocols support different speed (baud rate), distance(network length) and the number of connecting devices (nodes).

# Protocol/Cable Baud Rate Length Node
01 Ethernet 100 Mb/s (Few Km) 255
02 Profibus 5-12 Mb/s 15 Km 127
03 MPI 19.2- 38.4 Kb/s 50 m 32
04 PPI 187.5 Kb/s 500 m 1
05 DH 230.4 Kb/s 3.048 Km 64
06 Control Net 5 Mb/s 30 Km  
07 Device Net 500 Kb/s 0.487 64
08 USB Adapter 57.6 Kb/s 10 m 1
09 PC Adapter 9600 Kb/s 15 m 1
10 RS-232 19.2 Kb/s 10 m 1
11 RS-485 10 Kb/s 1.2 Km 32

Which PLC communication protocol you should use?

  • If you want to communicate with the more number of nodes with more speed, Ethernet is the best choice. 
  • If your network has a length of more than 25 Kilo-meter, you should use the Control Net protocol.

Binary Data Type Conversion for Baud Rate

Binary system based on the bit. Bit is either 0 or 1.

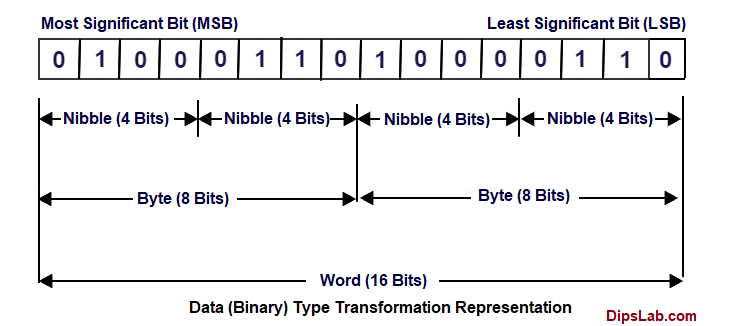
  • 1 Nibble= 4 Bits
  • 1 Byte= 8 Bits
  • 1 Word= 2 Bytes = 16 Bits
  • 1 Double Word= 4 Bytes= 32 Bits

Let’s see, binary data representation diagram.

This is all about topmost PLC communication protocols. And I also covered the basic fundamental parts of protocol like Baud rate (communication speed), network length and the number of nodes supported by each protocol.


산업 모니터링에 관한 다른 Contents도 확인 하세요. 


Basics of PLC Modules | Different Types of PLC Modules

Table of Contents

Different types of PLC Modules

A programmable logic computer (PLC) is an industrial digital computer that is generally used to control the process. As it is an industrial computer, a logical program to control the process is prepared in the general computer.

Then this program is transferred to the PLC using cables. This program is stored in the PLC memory.

The logical program is prepared using a programming language called Ladder logic, Statement List, or Functional block diagram. A program is prepared in such a way that the peoples with electrical or instrumentation background can easily understand.

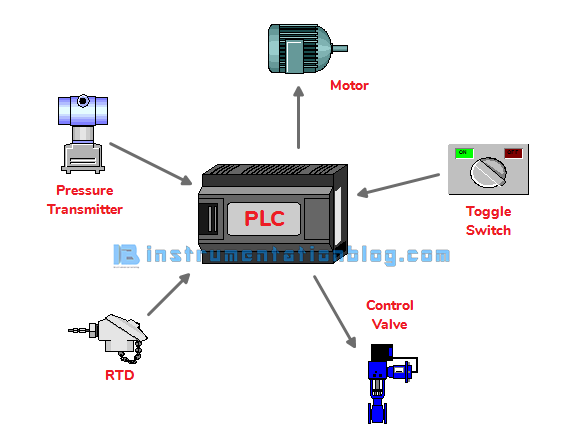
A Programmable Logic Controller consists of various inputs and outputs modules. A PLC monitors the status of switches and sensors using input terminals and based on this status they will give the command to the output devices through the output terminals.

For more details about PLC, you can refer to the article about What is PLC? How does it work?


PLC Hardware

In this article, we are going to see different types of PLC modules. PLC hardware consists of various modules such as,

  • Power Supply Module (PS)
  • CPU
  • Interface Module (IM)
  • Signal Modules (SM)
  • Function Module (FM)
  • Communication Processor (CP)


There are mainly two types of PLCs, generally, we can find in the industry, in terms of hardware

1. Fixed PLC or Compact PLC

Compact OR Fixed PLC

All the modules are within a single case. This type of PLC has a fixed number of Input/Output modules.

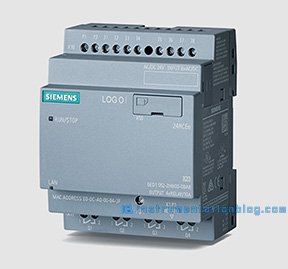
The power supply, CPU, and communication card are within a single case. From the below image you can get some ideas about the compact or fixed plc.


2. Modular PLC

Modular PLC

The name itself suggests that this type of PLC consists of various modules. Inputs and Outputs modules can be easily expanded just by adding the modules.

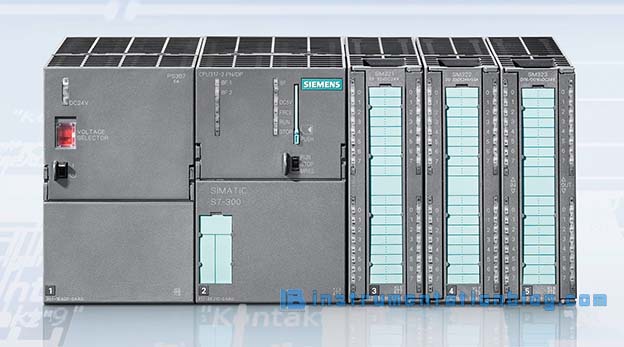
All the modules are fitted in the rack, that’s why it is also called rack mounted PLC. The below image shows the modular type PLC.


Block Diagram of Siemens PLC Modules

Modular PLCs are the most commonly used PLCs in the industry because it has the reliability to extends the I/Os. There is a rack or chassis in which all the modules are mounted and internally communicated with each other that’s why it is also called “Rack Mounted PLC”.

1) Rack or Chassis

The rack or chassis is the most important hardware part of the PLC.

The rack or chassis allows all the plc modules to be mounted or connected to a communication bus to communicate with the CPU.

The main functions of the rack or chassis are

  • It distributes power evenly
  • It houses different input-output modules
  • It acts as a link between the CPU and different modules


2) Power Supply Module (PS)

The power supply module is used to gives the appropriate voltage to a different module as well as the CPU of the PLC system.

The PLC system mostly works with 24V DC voltage, PLC power supply converts line voltage of 100-240 VAC into lower DC voltage generally 24 VDC. PLC power supplies can come in different sizes and ratings based on different plc and applications.

The most common current rating of the power supply module is 5-20 amps for smaller plc systems and it can go up to 50 amps for more complex plc systems.


3) Central Processing Unit (CPU)

Central Processing Unit, we can say that this is the brain of this system. The program in the form of logical instructions is stored in the CPU.

All the arithmetic and logical functions are performed in the CPU. It executes the instructions as per the stored program by the user.

The Processor in the CPU is used to do computation like managing the computer’s memory, monitoring the status of inputs, and activating output according to the user’s logical instructions.

The Memory in the CPU is used to store programs and data from the different equipment connected to PLC.


4) Interface Module (IM)

The interface module is used when you want to expand input-output modules and you don’t have space for extra modules in the main rack. You have to connect the other rack with the main rack to communicate it with the CPU.

The interface module is used to connect the other racks with the main rack.


5) Signal Module (SM)

There are different inputs and outputs are connected with the PLC. These inputs and outputs may be digital or analog.

Field Devices

There are mainly four types of modules are available

  1. Digital Input Module
  2. Digital Output Module
  3. Analog Input Module
  4. Analog Output Module

Sometimes, based on the user requirement, a combination of digital input/output and analog input/output modules are also used.


6) Function Module (FM)

It is an optional module and used with the modular types of PLC. This type of module is generally used with a special type of controlling such as,

  • High-Speed Counter Module
  • PID Module
  • Weighing Module


7) Communication Processor (CP)

The communication processor module is used mainly for communication with different controllers or devices such as other PLCs, SCADA, HMI, and other controllers.


산업 모니터링에 관한 다른 Contents도 확인 하세요. 


  • 2024년 까지 매년 5.7%의 성장이 있을 것이다. 
  • 제조나 Chemical, waste보다 Oil&Gas 산업의 SCADA 수요가 많은 것은 참고 해 볼만 하다. 
  • Oil&Gas쪽에 진출 한다면, 지금 보다 더 큰 고객을 만들수 있을듯. 

아래 내용은 www.imarcgroup.com/global-scada-market 에서 발췌한 내용입니다. 

Global SCADA Market to Reach US$ 26 Billion by 2024, Spurred by Increasing Employment in Oil and Gas Industry

Published on Jun 19, 2019

According to the latest report by IMARC Group, titled SCADA Market: Global Industry Trends, Share, Size, Growth, Opportunity and Forecast 2019-2024”, the global SCADA market size reached US$ 18.6 Billion in 2018. Supervisory control and data acquisition (SCADA) is an industrial control system (ICS) that employs computers, network data communications and graphical user interfaces for high-level process supervisory management. It assists in collecting information, transferring it back to the central computer, alerting the home station, carrying out the required analysis and displaying the analysis to the user. It provides the facility of storing large amounts of data and offers an interface to connect the different sensors deployed in an area. Additionally, it aids in maintaining efficiency, processing data for smart and quick decision making, and communicating system issues to help mitigate downtime.

Global SCADA Market Trends:

One of the pivotal factors bolstering the growth of the market is the growing popularity of SCADA systems around the world. This can be attributed to the assistance offered by these systems in distinguishing faults within the machinery and minimizing potential defects. Besides this, the cost-effectiveness of the SCADA framework is also stimulating the demand for these systems around the world. They can also disseminate power by re-steering electricity from excess capacity regions to areas with a lack of power supply. Another factor which is impelling the market growth is the increasing employment of SCADA systems in the oil and gas industry since they help in enhancing the extraction output, streamlining production and minimizing losses. Looking forward, the market is projected to reach a value of US$ 26 Billion by 2024, expanding at a CAGR of around 5.7% during 2019-2024.

Market Summary:

  • Based on the component, the market has been classified into the programmable logic controller (PLC), remote terminal units (RTU), human machine interface (HMI), communication systems and others.
  • On the basis of the architecture, the market has been divided into hardware, software and services. Currently, services account for the majority of the total market share.
  • The market has been analyzed on the basis of the end user into oil and gas, power, water and wastewater, manufacturing, chemicals and petrochemicals, pharmaceutical and others. Presently, the oil and gas segment exhibits a clear dominance in the market.
  • Region-wise, the market has been segregated into Europe, North America, Asia Pacific, Latin America, and Middle East and Africa. Amongst these, North America represents the largest market, holding the majority of the global share.
  • The competitive landscape of the market has been examined with some of the key players being ABB Ltd., Emerson Electric Co., Rockwell Automation, Inc., Schneider Electric SE, Siemens AG, Alstom, General Electric Co., Honeywell International, Inc., Omron Corporation, Yokogawa Electric Corporation, Iconics Inc., Elynx Technologies, LLC, Enbase LLC, Globalogix and Inductive Automation.

산업 모니터링에 관한 다른 Contents도 확인 하세요. 


  • 아래 내용은 애덤 그랜트의 오리지널스에 있는 내용이다. 
  • 크롬사용자가 IE사용자 보다 업무 능력이 있다는 내용이다. 
  • 그러면 크롬만 받으면 업무 능률이 오르나? 그건 아니다. 
  • 그 차이이는 조금 더 효율적으로 업무를 개선하려는 노력(주도력)의 차이이다. 
  • 그렇다면, 자신에 맞는 Tool을 찾는 노력만으로도 우리는 다른 직원보다 한발 앞서 나가는 것이다. 

경제학자 마이클 하우스먼(Michael Houseman)이 고객 상담원들의 재직 기간 차이의 이유를 밝히기 위한 프로젝트를 진행하다가 놀라운 사실을 발견했다. 웹브라우저로 파이어폭스(Firefox)나 크롬(Chrome)을 사용한 직원들이 인터넷 익스플로러(Internet Explorer)나 사파리(Safari) 사용자들보다 재직 기간이 15%나 더 길었으며, 결근율도 19%나 낮았다.

이어 하우스먼과 그의 연구팀은 판매 실적, 고객 만족도, 평균 통화 지속 시간 등에 대해 거의 300만 건의 자료를 모아서 분석했다. 그 결과 파이어폭스나 크롬을 사용하는 직원들이 판매 실적이 훨씬 좋았고, 평균 통화 시간도 짧았고, 고객 만족도도 높았다. 그들은 인터넷 익스플로러나 사파리를 사용하는 직원들이 입사 120일 후에야 달성한 업무 능력을 90일 만에 보여주었다.

왜 이런 차이가 나는 걸까? 하우스먼은 컴퓨터에 관한 기술적 지식과 숙련도 등 다양한 요인을 분석한 결과 그 차별화 요인은 바로 그들이 브라우저를 획득한 방법에 있음을 밝혀냈다. PC를 구입하고 나서 처음으로 켜면 인터넷 익스플로러 또는 사파리가 내장되어 있다. 고객 상담원들 가운데 2/3가 내장된 브라우저를 사용했는데, 그들은 더 나은 브라우저가 있지 않을까 의문조차 품지 않았다.

파이어폭스나 크롬을 사용하려면 내장된 기능을 그대로 수용하지 않고 주도력(initiative)을 발휘해서 더 나은 선택지를 찾아야 한다. 바로 그 주도력이 업무 수행 능력을 예측할 수 있는 단서가 된다. 내장된 브라우저를 그냥 사용한 상담원들은 자신이 하는 일에도 같은 접근 방식을 적용했다. 그들은 회사에서 준 각본대로 판매했고, 고객 불만을 접수할 때도 표준 절차를 따랐다. 그들은 자신의 직무를 회사가 정해준 고정불변의 것으로 여겼고, 자기 일에 불만이 생기면 결근을 하기 시작하다가 결국 사직했다.

반면 주도적으로 브라우저를 파이어폭스나 크롬으로 바꾼 직원들은 자신들이 하는 일에 달리 접근했다. 그들은 고객들에게 상품을 팔고, 고객들의 불만을 해소할 새로운 방법을 모색했다. 그들은 마음에 들지 않는 상황에 맞닥뜨리면 상황을 바로잡았다. 자신이 처한 상황을 주도적으로 개선했으므로 그들은 이직할 이유가 없었다. 그들은 자신의 일을 자기가 원하는 방식으로 재창조했다.


산업 모니터링에 관한 다른 Contents도 확인 하세요. 


'ForBeginner' 카테고리의 다른 글

3-3. PLC 모듈 종류  (0) 2021.05.14
3-2. Global SCADA Market by 2024  (0) 2021.05.13
8-3. mssql (detach & Attach vs backup &Restore의 차이)  (0) 2021.05.11
8-3. MSSQL 데이터 파일(MDF, LDF, NDF)  (0) 2021.05.11
4-4. OPC 통신.  (0) 2021.05.11

+ Recent posts